
Store Footfall Analytics
See where shoppers go and how long they stay.
Measure visits, paths, and dwell across defined store zones. Compare periods and locations to review layouts, promotions, and staffing.
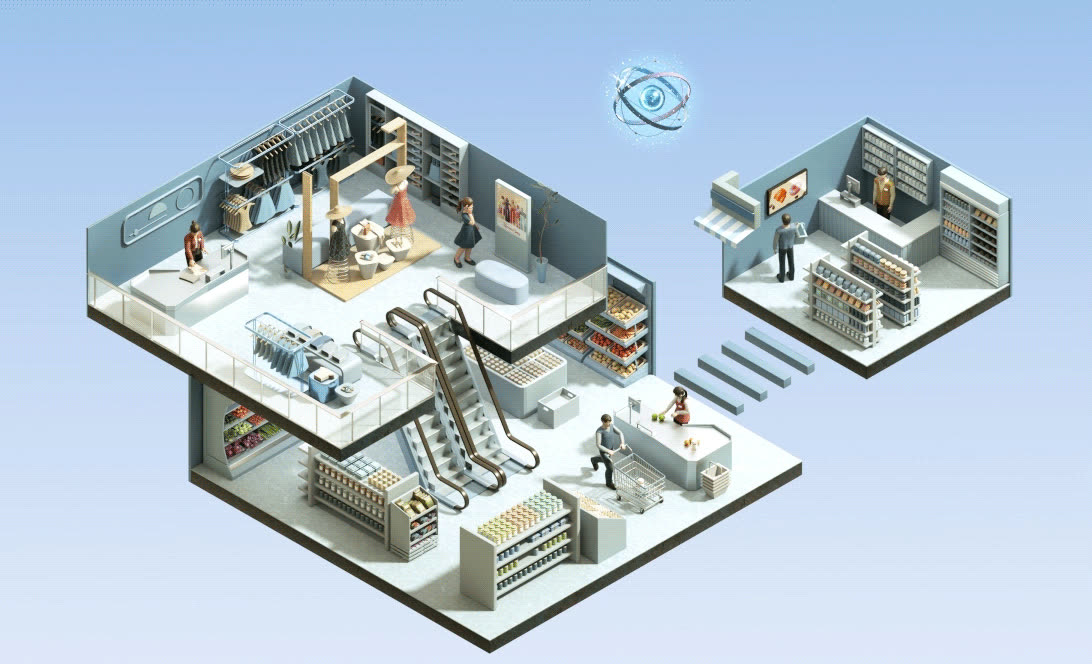
- Entries & exits
- Dwell
- Movement & journeys
- Heatmaps
Understand visits and movement by zone
Compare periods, zones, or stores using the same measurement definitions. Use observed patterns to choose and evaluate the next change.
Traffic
Find busy zones and peak visiting hours
Compare visits by zone and time band to review promotion placement and staffing needs.
Journey
Review layouts using observed journeys
Find less-visited zones and review layout changes using observed paths and dwell patterns.
Operations
Compare traffic and dwell before and after changes
Compare visits and dwell using the same periods, zones, and metric definitions when reviewing operating changes.
Define the zones and metrics for your store decision
Choose the operating question, check camera coverage, and set a comparison period.
-
01
Define the business question
Set the retail challenge together, whether that is increasing dwell or measuring performance in a specific pop-up zone.
-
02
Check the camera environment
Assess existing cameras, zone coverage, and data-handling requirements before choosing the configuration.
-
03
Set up the comparison
Set the periods, zones, and metric definitions to use when reviewing the proposed operating change.
Vision AI for visits, movement, and dwell
Camera analysis measures visits, paths, and dwell in configured store zones. We agree on camera coverage, data handling, and report definitions for each site.
An on-site assessment identifies the camera view best suited to the analysis.
Report measurement metrics alongside decision-ready statistical indicators.
Where video export requires masking, it follows a separate review and approval workflow from store analytics.
Review visits and paths in the dashboard
Visualize customer journeys with clear metrics, heatmaps, and comparison views.
Hourly and daily traffic, entry, and dwell trends
Customer-path flow diagrams
Store heatmaps and cross-store KPI comparisons
Re-ID for reliable customer-only data
Customer case
Visits and journeys at insurance branches
- Environment
- Insurance service network
- Analysis
- Signage attention, entry, paths, and dwell
- Application
- Review of content and consultation-space placement
Customer case
Hotel congestion and waiting-flow analysis
- Environment
- Hotel restaurant and swimming pool
- Analysis
- Occupancy, waiting counts, and zone heatmaps
- Application
- Congestion information and operating-plan review
Ask questions about your connected store data
The AI Agent is a separate solution that requires agreed data connections. It analyzes authorized data, summarizes results, exports CSV files, and recommends actions. Your team reviews the recommendations and carries them out.
Questions using connected data
Find the stores and time bands with the largest change in entries over the last four weeks.
Which store had the longest customer dwell during weekend peak hours over the past month?
Create a table that compares Zone A entries with the same weekday last week.
Answers use only connected data within your account and workspace permissions. Each answer shows the period, filters, and metrics and distinguishes observations from interpretation.

Frequently asked questions
How is this different from a door counter?
A door counter focuses on entries. A configured store analytics installation can add zone dwell, movement, heatmaps, and journey comparisons when the environment and camera coverage support them.
Can employees be excluded?
Yes. Training for uniforms and zone-specific filters can distinguish staff from customers in a way that supports more reliable analysis.
Is tracking across cameras included?
It is assessed separately from the standard analysis scope. Matching observations across views depends on camera specifications, coverage, and the physical environment.
Start with one store decision
The demo maps the relevant zones, current counters or cameras, analysis views, and comparison plan.
After the demo, we summarize the suitable analysis and next site-review step.